
Subscribe for more!
Subscribe to our newsletter for insights and articles on wide ranging issues including reputation management, branding, advertising, awareness, advocacy, and communications. You can unsubscribe anytime.
Follow us on social:
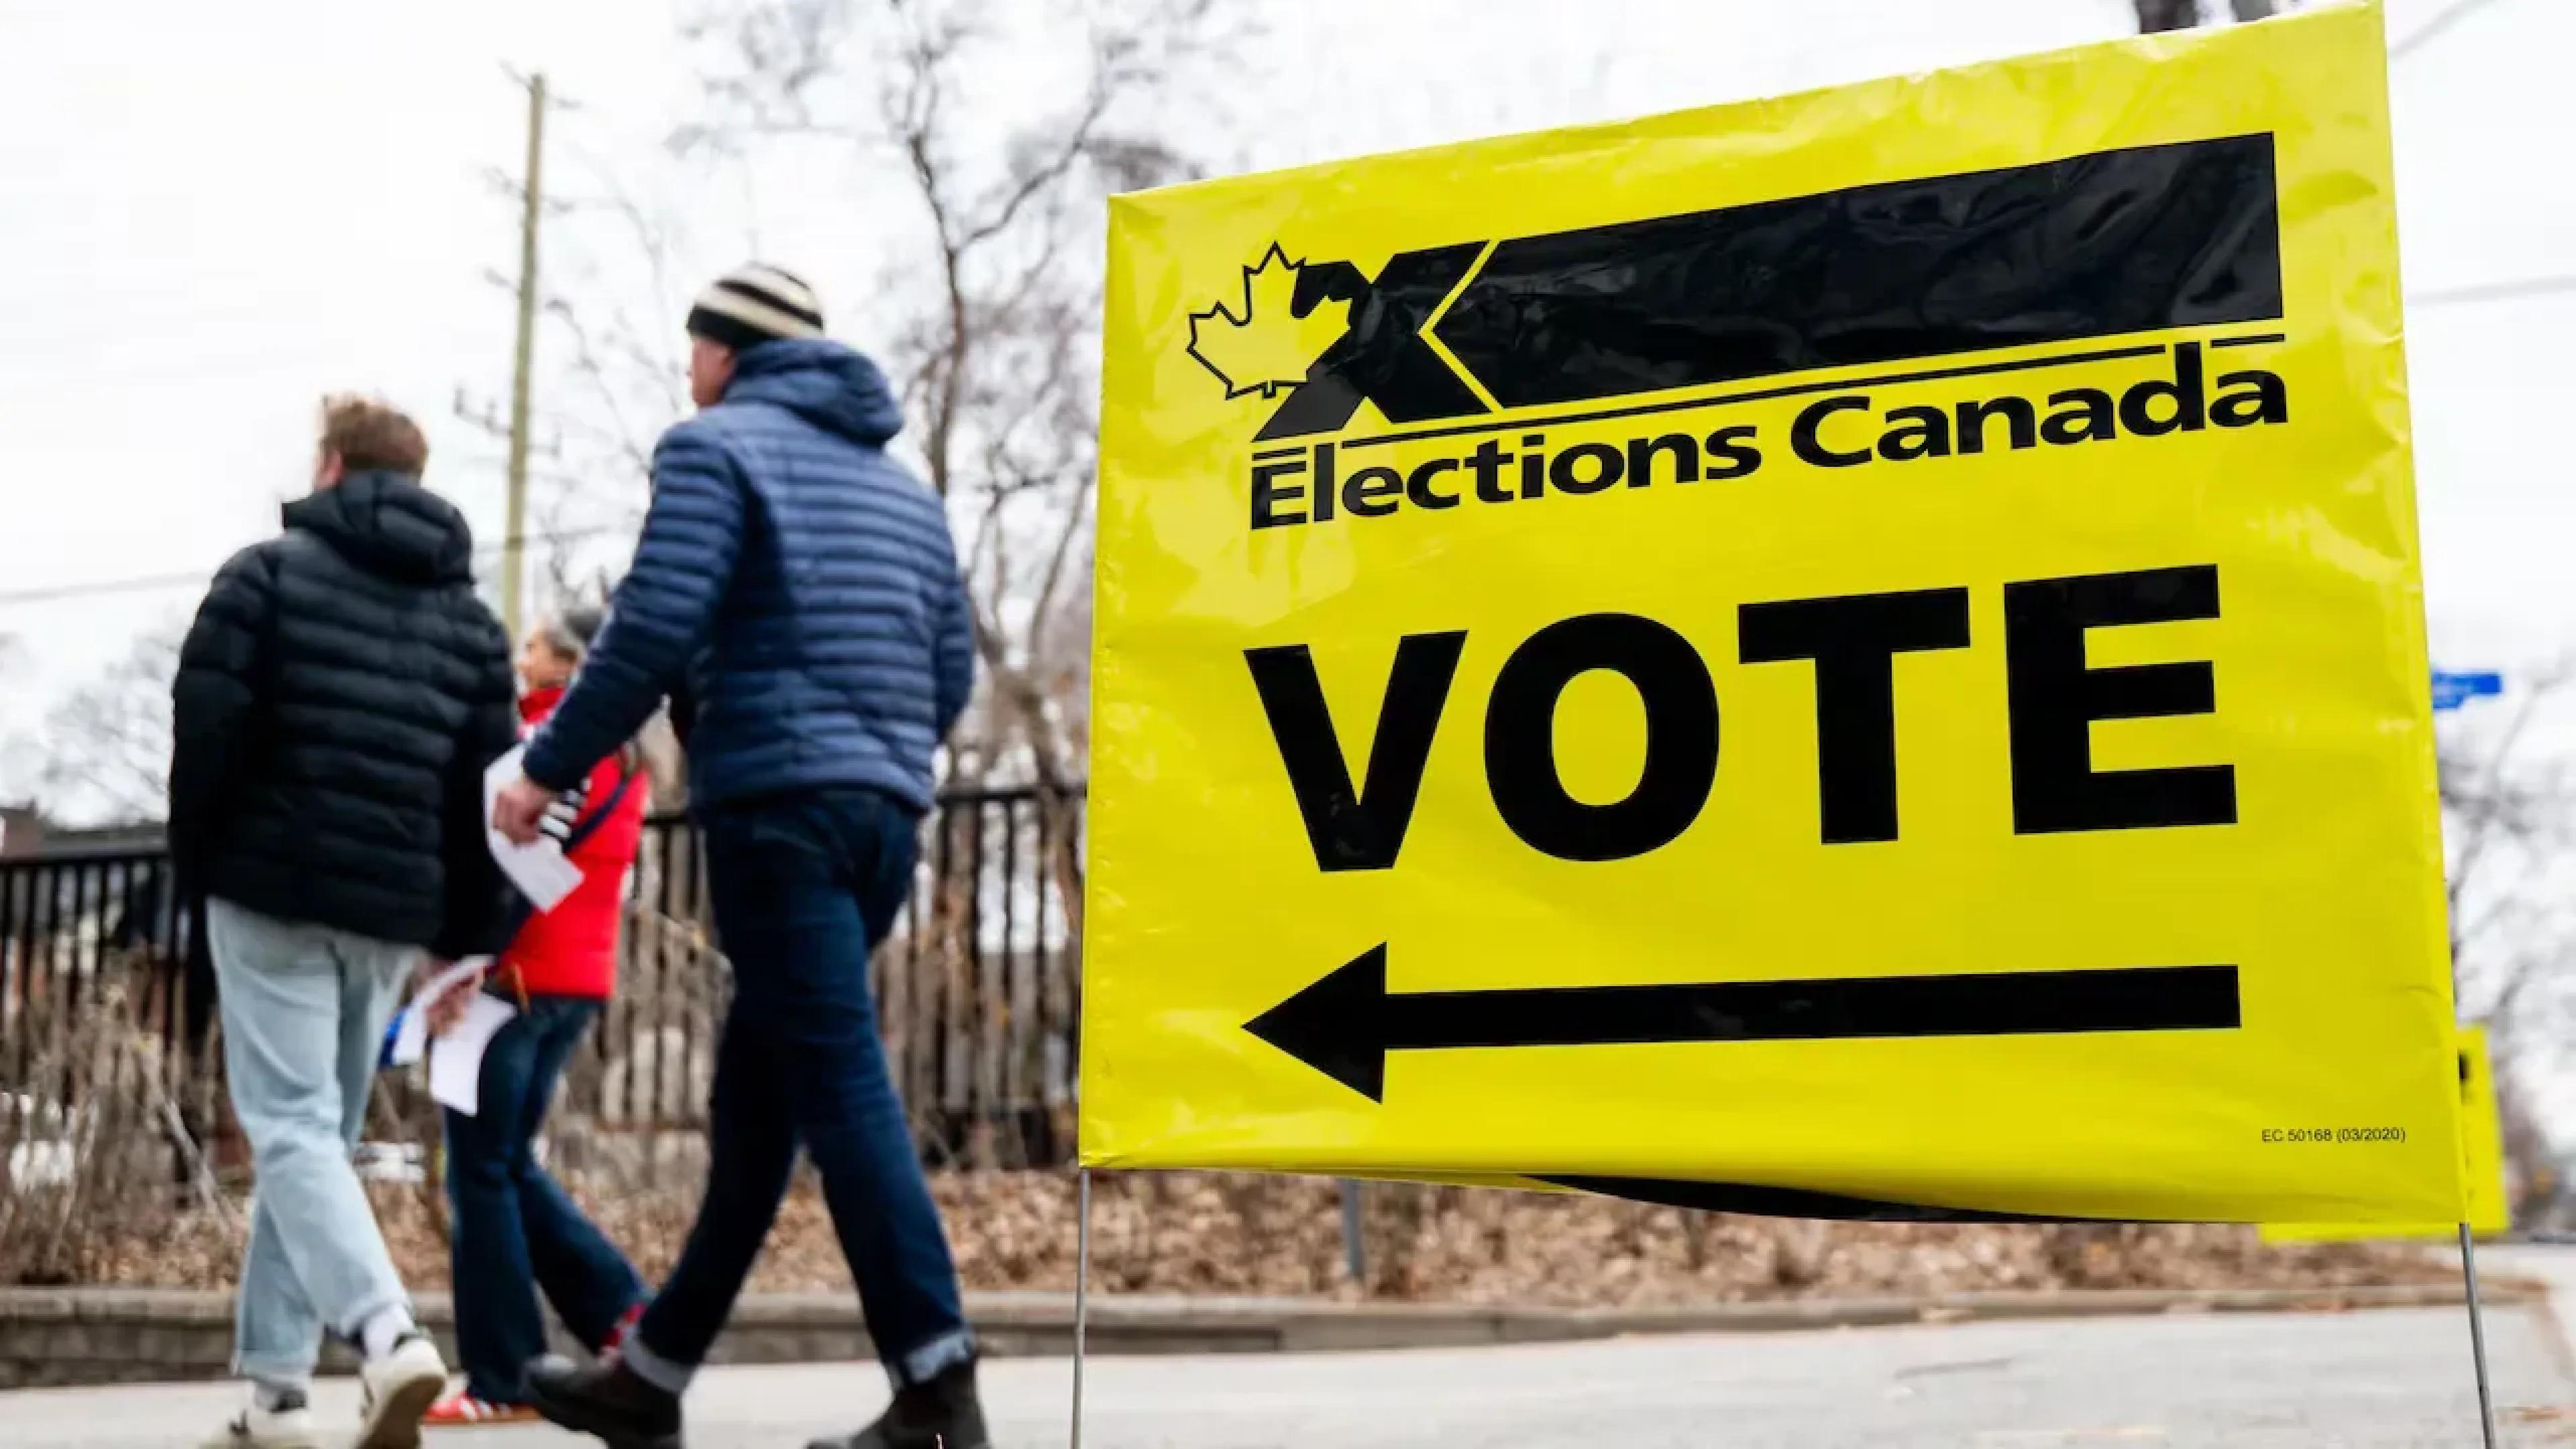
Always lots of coverage of top line horse race numbers, but that can be like putting vaseline on the lens. Elections turn on a pretty small group of voters who are up for grabs.
When trying to image outcomes of US presidential elections, it’s normal to focus on a list of about 6-7swing states and more or less ignore the rest. What happens in Pennsylvania, Georgia, Arizona, Nevada, North Carolina, Wisconsin, Michigan pretty much decide which candidate gets the required number of electoral college votes and moves into the White House.
But a lot of coverage of Canadian voting intentions doesn’t bother to narrow the focus, even though it’s not that hard to do so.
In our latest Spark Insights national survey of 2895 adults across the country (November 7-11), we introduced a new swing voter lens. Here are the main takeaways.
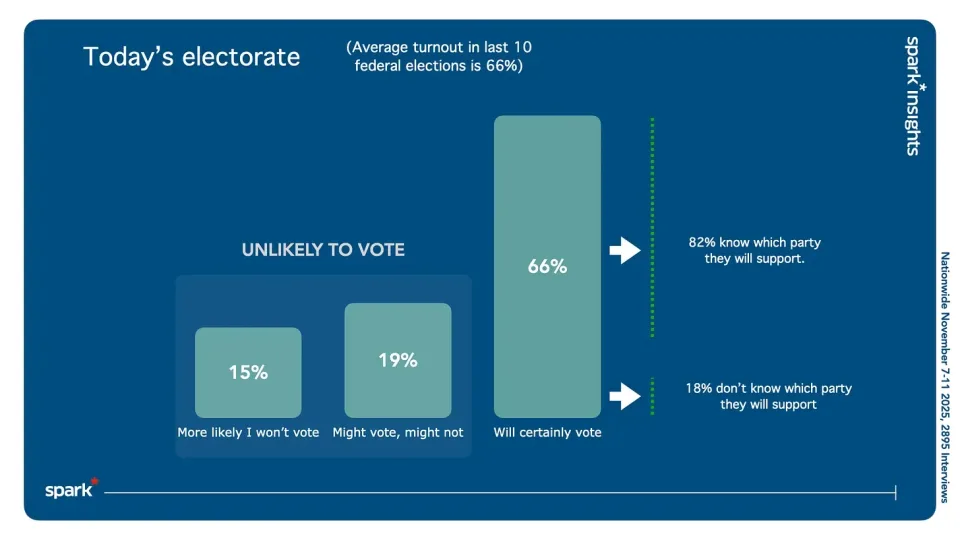
In the last 10 federal elections, turnout averaged 65%. There’s always going to be a bit of fluctuation but it’s a pretty good bet that turnout will be at about that level.
When we tell respondents that roughly a third of eligible voters don’t cast a ballot, and then ask them if they will vote at the next opportunity, we find people sorting themselves into likely and unlikely voters pretty easily.
(A question designed in that way, makes it easier for people to acknowledge a behaviour that they may feel is socially frowned upon.)
Two thirds say they will “certainly vote”. The others say the “might or might not” or “more likely won’t”. While it’s never going to be precisely accurate, this allows for a pretty easy focus on the 66% who say they will certainly vote, given that it is almost exactly the number of people who usually do vote.
Of the likely voters, 82% say they already know which party they are going to vote for. That leaves 18% - or just 12% of the total pool of eligible voters - asserting that they will vote but are not yet sure how they will vote.
In our analysis, we spend more time focusing on these swing voters, in order to understand the ebb and flow of politics. Doing otherwise introduces a lot of information about voters that either aren’t going to vote or whose partisan choices are fairly locked in - it’s not bad information, it’s just not very revealing.
Using this technique in our latest survey highlighted some things worth knowing:
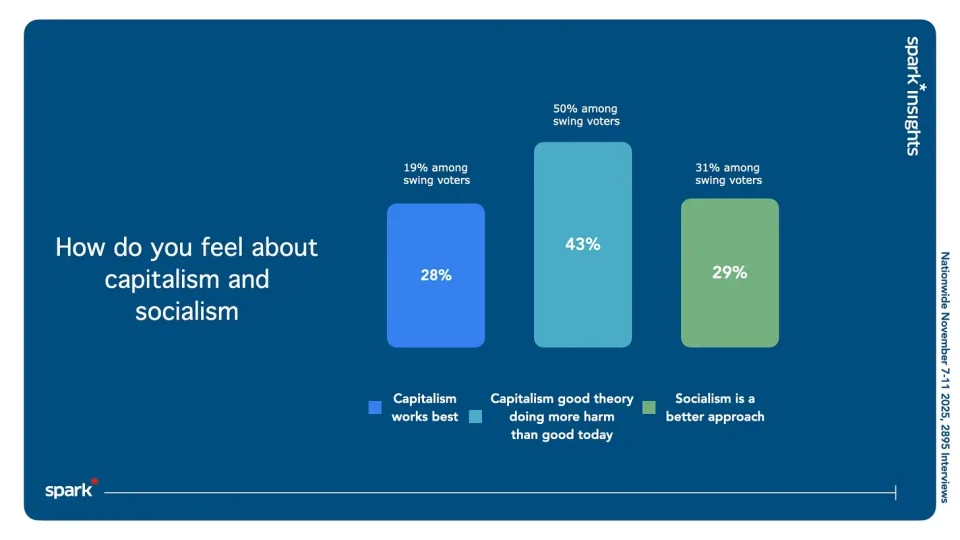
One thing we’ll be watching carefully is an answer to a different question we pose regularly, about capitalism and socialism. Roughly equal numbers think capitalism is best (28%) as think socialism is better (29%). The plurality feels capitalism is good in theory but is doing more harm than good today.
This feeling is even more pronounced among swing voters. As they look at economic policy, they’ll be looking for growth oriented policies, and increased private sector investment - but will harbour a concern that capitalism doesn’t always deliver benefits evenly, and can harm people if left completely unchecked.
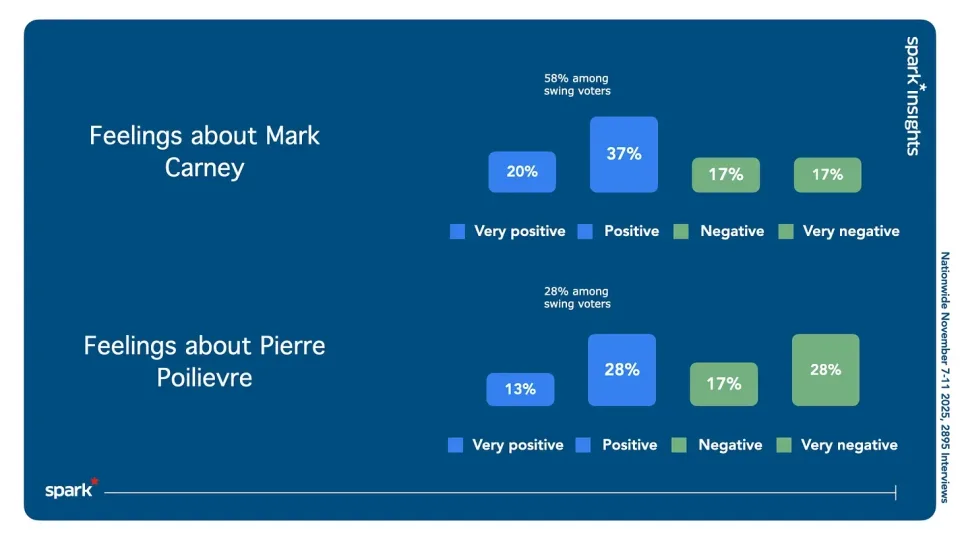
One last finding that our current surveys point to, is the fact that the “unlikely voters” tend to include more people who voted Conservative in the last election. We’ll monitor and explore this a bit more, but it may well be that the motivation advantage the CPC had in the last couple of elections has flipped around - as Conservative voters are more open to Carney policies, less frustrated with the Liberal Party, more uncomfortable with Trumpism, and perhaps a bit disappointed in Pierre Poilievre as well.
We’ll still report overall findings, and the shape of Canadian opinion of course, but we believe it’s valuable to focus on swing voters, in order to really understand how the big issues of the day are playing out. And, needless to say, how swing voters felt two weeks ago may or may not be how they feel today or tomorrow - so we’ll keep watching.
The data referenced were gathered online, with a representative sample of 2,895 adults across Canada, between the dates November 7, 2025 and November 11, 2025.
spark*insights is led by Bruce Anderson, one of Canada’s leading and most experienced public opinion researchers. From polling and research to analysis and guidance, we help organizations, uncover the factors driving or influencing public perception to gain valuable insights into the shape and movement of the landscape.
Tell us your needs, challenge us with your project, get an estimate, come for a coffee and a chat (or reach out for a virtual one)!
Address: 71 Bank Street, 6th Floor, Ottawa, Ontario, K1P 5N2
Email: hello@sparkadvocacy.ca
Telephone: (613) 367-5513
Follow us on social:

© 2026 spark*advocacy Inc., All rights reserved.